Openlayers实现测量功能
- 作者: 迷路的千里马
- 来源: 51数据库
- 2021-07-11
本文实例为大家分享了openlayers实现测量的具体代码,供大家参考,具体内容如下
由于公司项目需要使用到openlayers,就开始学习了openlayers,其中有一个需求需要用到测量功能,就参考《webgisopenlayers全面解析》写了一个小demo,话不多说,直接上代码:
<!doctype html>
<html>
<head>
<meta http-equiv="content-type" content="text/html; charset=utf-8" />
<title></title>
<link rel="stylesheet" type="text/css">
<script src="./ol.js" type="text/javascript"></script>
<link rel="stylesheet">
<script src="http://www.51sjk.com/Upload/Articles/1/0/260/260744_20210701004246608.js"></script>
<script src="http://www.51sjk.com/Upload/Articles/1/0/260/260744_20210701004246617.js"></script>
<style type="text/css">
#map {
width: 100%;
height: 100%;
position: absolute;
}
#menu {
float: left;
position: absolute;
bottom: 50px;
right: 30px;
z-index: 2000;
}
.checkbox {
left: 20px;
}
/**
* 提示框的样式信息
*/
.tooltip {
position: relative;
background: rgba(0, 0, 0, 0.5);
border-radius: 4px;
color: white;
padding: 4px 8px;
opacity: 0.7;
white-space: nowrap;
}
.tooltip-measure {
opacity: 1;
font-weight: bold;
}
.tooltip-static {
background-color: #ffffff;
color: black;
border: 1px solid white;
}
.tooltip-measure:before,
.tooltip-static:before {
border-top: 6px solid rgba(0, 0, 0, 0.5);
border-right: 6px solid transparent;
border-left: 6px solid transparent;
content: "";
position: absolute;
bottom: -6px;
margin-left: -7px;
left: 50%;
}
.tooltip-static:before {
border-top-color: #ffffff;
}
#scalebar {
float: left;
margin-bottom: 10px;
}
</style>
</head>
<body>
<div id="map">
<div id="menu">
<label>测量类型选择</label>
<select id="type">
<option value="length">长度</option>
<option value="area">面积</option>
</select>
<label class="checkbox label"><input type="checkbox" id="geodesic" />使用大地测量</label>
</div>
</div>
<div id="scalebar"></div>
<script type="text/javascript">
$(function () {
//格式
var format = 'image/png';
var bounds = [73.441277, 18.159829,
135.08693, 53.561771];//范围
//中国各省底图(面)
var imagemap = new ol.layer.tile({
source: new ol.source.tilewms({
ratio: 1,
//自己的服务url
url: 'http://localhost:8080/geoserver/china_test/wms',
//设置服务参数
params: {
'format': format,
'version': '1.1.0',
styles: '',
//图层信息
layers: 'china_test:c_test',
}
})
});
//设置地图投影
var projection = new ol.proj.projection({
code: 'epsg:4326',//投影编码
units: 'degrees',
axisorientation: 'neu'
});
//设置地图 实例化一个地图
var map = new ol.map({
//地图中的比例尺等控制要素
controls: ol.control.defaults({
attribution: false
}).extend([
new ol.control.fullscreen(),//全屏显示
]),
//设置显示的容器
target: 'map',
//设置图层
layers: [
//添加图层
imagemap
],
//设置视图
view: new ol.view({
//设置投影
projection: projection,
center: [102.73333, 25.05], //初始在某一点
minzoom: 3,
zoom: 5, //缩放级别
}),
});
//定义矢量数据源
var source = new ol.source.vector();
//定义矢量图层
var vector = new ol.layer.vector({
source: source,
style: new ol.style.style({
fill: new ol.style.fill({
color: 'rgba(255,255,255,0.2)'
}),
stroke: new ol.style.stroke({
color: '#e21e0a',
width: 2
}),
image: new ol.style.circle({
radius: 5,
fill: new ol.style.fill({
color: '#ffcc33'
})
})
})
});
//将矢量图层添加到地图中
map.addlayer(vector);
//添加比例尺控件
var scalelinecontrol = new ol.control.scaleline({
units: 'metric',
target: 'scalebar',
classname: 'ol-scale-line'
});
map.addcontrol(scalelinecontrol);
//实例化鼠标位置控件
var mousepositioncontrol = new ol.control.mouseposition({
coodrdinateformat: ol.coordinate.createstringxy(4),//坐标格式
//地图投影坐标系
projection: new ol.proj.projection({
code: 'epsg:4326',//投影编码
units: 'degrees',
axisorientation: 'neu'
}),
//classname:'tip',
target: document.getelementbyid('tip'),//显示鼠标位置信息的目标容器
undefinedhtml: ' '//未定义坐标标记
});
//添加鼠标位置控件
map.addcontrol(mousepositioncontrol);
//实例化鹰眼控件
var overviewmapcontrol = new ol.control.overviewmap({
//在鹰眼中相同坐标系下不通数据源的图层
layers: [
new ol.layer.tile({
source: new ol.source.osm({
'url': 'http://{a-c}.tile.opencyclemap.org/cycle/{z}/{x}/{y}.png'
})
})
],
collapselabel: '?',
lable: '?',
collapsed: false,
});
//添加鹰眼
map.addcontrol(overviewmapcontrol);
//创建一个wgs84球体对象
var wgs84sphere = new ol.sphere(6378137);
//创建一个当前要绘制的对象
var sketch = new ol.feature();
//创建一个帮助提示框对象
var helptooltipelement;
//创建一个帮助提示信息对象
var helptooltip;
//创建一个测量提示框对象
var measuretooltipelement;
//创建一个测量提示信息对象
var measuretooltip;
//继续绘制多边形的提示信息
var continuepolygonmsg = '单击以继续绘制多边形';
//继续绘制线段的提示信息
var continuelinemsg = '单击以继续绘制直线';
//鼠标移动触发的函数
var pointermovehandler = function (evt) {
//indicates if the map is currently being dragged.
//only set for pointerdrag and pointermove events. default is false.
//如果是平移地图则直接结束
if (evt.dragging) {
return;
}
//帮助提示信息
var helpmsg = '单击开始';
if (sketch) {
//获取绘图对象的几何要素
var geom = sketch.getgeometry();
//如果当前绘制的几何要素是多线段,则将绘制提示信息设置为多线段绘制提示信息
if (geom instanceof ol.geom.polygon) {
helpmsg = continuepolygonmsg;
} else if (geom instanceof ol.geom.linestring) {
helpmsg = continuelinemsg;
}
}
//设置帮助提示要素的内标签为帮助提示信息
helptooltipelement.innerhtml = helpmsg;
//设置帮助提示信息的位置
helptooltip.setposition(evt.coordinate);
//移除帮助提示要素的隐藏样式
$(helptooltipelement).removeclass('hidden');
};
//触发pointermove事件
map.on('pointermove', pointermovehandler);
//当鼠标移除地图视图的时为帮助提示要素添加隐藏样式
$(map.getviewport()).on('mouseout', function () {
$(helptooltipelement).addclass('hidden');
});
//获取大地测量复选框
var geodesiccheckbox = document.getelementbyid('geodesic');
//获取类型
var typeselect = document.getelementbyid('type');
//定义一个交互式绘图对象
var draw;
//添加交互式绘图对象的函数
function addinteraction() {
// 获取当前选择的绘制类型
var type = typeselect.value == 'area' ? 'polygon' : 'linestring';
//创建一个交互式绘图对象
draw = new ol.interaction.draw({
//绘制的数据源
source: source,
//绘制类型
type: type,
//样式
style: new ol.style.style({
fill: new ol.style.fill({
color: 'rgba(255,255,255,0.2)'
}),
stroke: new ol.style.stroke({
color: 'rgba(0,0,0,0.5)',
linedash: [10, 10],
width: 2
}),
image: new ol.style.circle({
radius: 5,
stroke: new ol.style.stroke({
color: 'rgba(0,0,0,0.7)'
}),
fill: new ol.style.fill({
color: 'rgba(255,255,255,0.2)'
})
})
})
});
//将交互绘图对象添加到地图中
map.addinteraction(draw);
//创建测量提示框
createmeasuretooltip();
//创建帮助提示框
createhelptooltip();
//定义一个事件监听
var listener;
//定义一个控制鼠标点击次数的变量
var count = 0;
//绘制开始事件
draw.on('drawstart', function (evt) {
//the feature being drawn.
sketch = evt.feature;
//提示框的坐标
var tooltipcoord = evt.coordinate;
//监听几何要素的change事件
//increases the revision counter and dispatches a 'change' event.
listener = sketch.getgeometry().on('change', function (evt) {
//the event target.
//获取绘制的几何对象
var geom = evt.target;
//定义一个输出对象,用于记录面积和长度
var output;
if (geom instanceof ol.geom.polygon) {
map.removeeventlistener('singleclick');
map.removeeventlistener('dblclick');
//输出多边形的面积
output = formatarea(geom);
//获取多变形内部点的坐标
tooltipcoord = geom.getinteriorpoint().getcoordinates();
} else if (geom instanceof ol.geom.linestring) {
//输出多线段的长度
output = formatlength(geom);
//获取多线段的最后一个点的坐标
tooltipcoord = geom.getlastcoordinate();
}
//设置测量提示框的内标签为最终输出结果
measuretooltipelement.innerhtml = output;
//设置测量提示信息的位置坐标
measuretooltip.setposition(tooltipcoord);
});
//地图单击事件
map.on('singleclick', function (evt) {
//设置测量提示信息的位置坐标,用来确定鼠标点击后测量提示框的位置
measuretooltip.setposition(evt.coordinate);
//如果是第一次点击,则设置测量提示框的文本内容为起点
if (count == 0) {
measuretooltipelement.innerhtml = "起点";
}
//根据鼠标点击位置生成一个点
var point = new ol.geom.point(evt.coordinate);
//将该点要素添加到矢量数据源中
source.addfeature(new ol.feature(point));
//更改测量提示框的样式,使测量提示框可见
measuretooltipelement.classname = 'tooltip tooltip-static';
//创建测量提示框
createmeasuretooltip();
//点击次数增加
count++;
});
//地图双击事件
map.on('dblclick', function (evt) {
var point = new ol.geom.point(evt.coordinate);
source.addfeature(new ol.feature(point));
});
}, this);
//绘制结束事件
draw.on('drawend', function (evt) {
count = 0;
//设置测量提示框的样式
measuretooltipelement.classname = 'tooltip tooltip-static';
//设置偏移量
measuretooltip.setoffset([0, -7]);
//清空绘制要素
sketch = null;
//清空测量提示要素
measuretooltipelement = null;
//创建测量提示框
createmeasuretooltip();
//移除事件监听
ol.observable.unbykey(listener);
//移除地图单击事件
map.removeeventlistener('singleclick');
}, this);
}
//创建帮助提示框
function createhelptooltip() {
//如果已经存在帮助提示框则移除
if (helptooltipelement) {
helptooltipelement.parentnode.removechild(helptooltipelement);
}
//创建帮助提示要素的div
helptooltipelement = document.createelement('div');
//设置帮助提示要素的样式
helptooltipelement.classname = 'tooltip hidden';
//创建一个帮助提示的覆盖标注
helptooltip = new ol.overlay({
element: helptooltipelement,
offset: [15, 0],
positioning: 'center-left'
});
//将帮助提示的覆盖标注添加到地图中
map.addoverlay(helptooltip);
}
//创建测量提示框
function createmeasuretooltip() {
//创建测量提示框的div
measuretooltipelement = document.createelement('div');
measuretooltipelement.setattribute('id', 'lengthlabel');
//设置测量提示要素的样式
measuretooltipelement.classname = 'tooltip tooltip-measure';
//创建一个测量提示的覆盖标注
measuretooltip = new ol.overlay({
element: measuretooltipelement,
offset: [0, -15],
positioning: 'bottom-center'
});
//将测量提示的覆盖标注添加到地图中
map.addoverlay(measuretooltip);
}
//测量类型发生改变时触发事件
typeselect.onchange = function () {
//移除之前的绘制对象
map.removeinteraction(draw);
//重新进行绘制
addinteraction();
};
//格式化测量长度
var formatlength = function (line) {
//定义长度变量
var length;
//如果大地测量复选框被勾选,则计算球面距离
if (geodesiccheckbox.checked) {
//获取坐标串
var coordinates = line.getcoordinates();
//初始长度为0
length = 0;
//获取源数据的坐标系
var sourceproj = map.getview().getprojection();
//进行点的坐标转换
for (var i = 0; i < coordinates.length - 1; i++) {
//第一个点
var c1 = ol.proj.transform(coordinates[i], sourceproj, 'epsg:4326');
//第二个点
var c2 = ol.proj.transform(coordinates[i + 1], sourceproj, 'epsg:4326');
//获取转换后的球面距离
//returns the distance from c1 to c2 using the haversine formula.
length += wgs84sphere.haversinedistance(c1, c2);
}
} else {
//计算平面距离
length = math.round(line.getlength() * 100) / 100;
}
//定义输出变量
var output;
//如果长度大于1000,则使用km单位,否则使用m单位
if (length > 1000) {
output = (math.round(length / 1000 * 100) / 100) + ' ' + 'km'; //换算成km单位
} else {
output = (math.round(length * 100) / 100) + ' ' + 'm'; //m为单位
}
return output;
};
//格式化测量面积
var formatarea = function (polygon) {
//定义面积变量
var area;
//如果大地测量复选框被勾选,则计算球面面积
if (geodesiccheckbox.checked) {
//获取初始坐标系
var sourceproj = map.getview().getprojection();
var geom = polygon.clone().transform(sourceproj, 'epsg:4326');
//获取多边形的坐标系
var coordinates = geom.getlinearring(0).getcoordinates();
//获取球面面积
area = math.abs(wgs84sphere.geodesicarea(coordinates));
} else {
//获取平面面积
area = polygon.getarea();
}
//定义输出变量
var output;
//当面积大于10000时,转换为平方千米,否则为平方米
if (area > 10000) {
output = (math.round(area / 1000000 * 100) / 100) + ' ' + 'km<sup>2</sup>';
} else {
output = (math.round(area * 100) / 100) + ' ' + 'm<sup>2</sup>';
}
return output;
};
//添加交互绘图对象
addinteraction();
});
</script>
</body>
</html>
效果图:
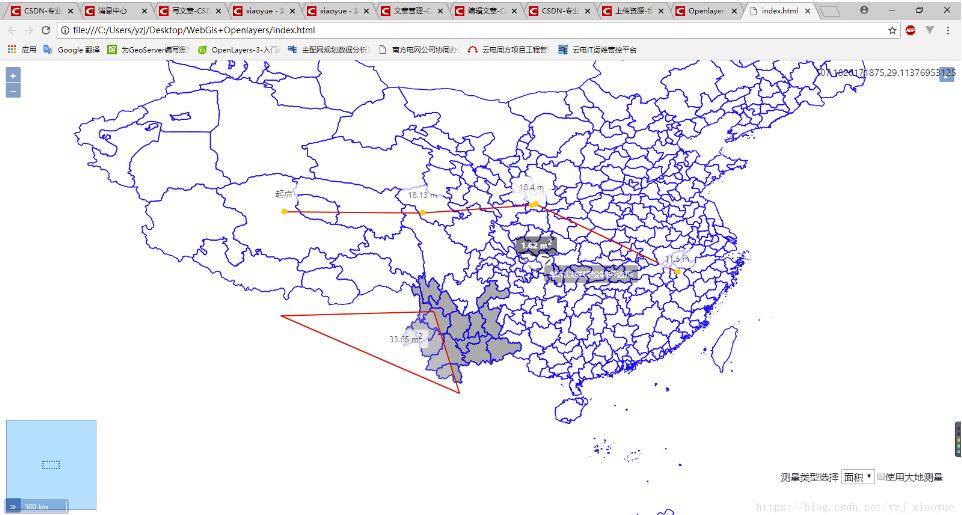
ps:这里调用的图层是使用geoserver发布的一个组合图层,可以自行定义。
源代码地址:测量实例
以上就是本文的全部内容,希望对大家的学习有所帮助,也希望大家多多支持。
推荐阅读