简单将ggplot多个图排列在一起
- 作者: 来_来_这狗让你先日
- 来源: 51数据库
- 2020-08-06
这里我们使用grid对ggplot的画图对象进行布局
# Multiple plot function
#
# ggplot objects can be passed in ..., or to plotlist (as a list of ggplot
# objects)
# - cols:   Number of columns in layout
# - layout: A matrix specifying the layout. If present, 'cols' is ignored.
#
# If the layout is something like matrix(c(1,2,3,3), nrow=2, byrow=TRUE),
# then plot 1 will go in the upper left, 2 will go in the upper right, and
# 3 will go all the way across the bottom.
# e=0.15, # extra height needed for last plot (vertical layout),
# or extra width for first plot (horizontal layout)
multiplot <- function(..., plotlist=NULL, file, cols=1,
                      layout=NULL, horizontal=FALSE, e=0.15) {
  require(grid)

  # Make a list from the ... arguments and plotlist
  plots = c(list(...), plotlist)

  numPlots = length(plots)
  #message(paste0('>>>>>>>INFO: num plots 2 = ', numPlots), '\n')

  # If layout is NULL, then use 'cols' to determine layout
  if (is.null(layout)) {
    # Make the panel
    # ncol: Number of columns of plots
    # nrow: Number of rows needed, calculated from # of cols
    layout = matrix(seq(1, cols * ceiling(numPlots/cols)),
                    ncol = cols, nrow = ceiling(numPlots/cols))
  }

  if (numPlots==1) {
    print(plots[[1]])

  } else {

    ## set up heights/widths of plots

    # extra height needed for last plot (vertical layout),
    # or extra width for first plot (horizontal layout)
    hei = rep(1, numPlots)
    # bottom plot is taller
    hei[numPlots] = hei[numPlots]*(1+e)
    wid = rep(1, numPlots)
    # first left plot is wider
    wid[1] = wid[1]*(1+e)
    # Set up the page
    grid.newpage()
    if(horizontal){
      pushViewport(viewport(layout = grid.layout(nrow(layout),
                                                 ncol(layout), widths=wid)))
    }else{
      pushViewport(viewport(layout = grid.layout(nrow(layout),
                                                 ncol(layout), heights=hei)))

    }

    # Make each plot, in the correct location
    for (i in 1:numPlots) {
      # Get i,j matrix positions of the regions containing this subplot
      matchidx = as.data.frame(which(layout == i, arr.ind = TRUE))
      print(plots[[i]], vp = viewport(layout.pos.row = matchidx$row,
                                      layout.pos.col = matchidx$col))
    }
  }
}


library(ggplot2)
p1 <- ggplot(iris, aes(x = Sepal.Length)) + geom_histogram() + theme_bw()
p2 <- ggplot(iris, aes(x = Sepal.Length, y = Petal.Width)) + geom_point() + theme_bw()

# 直接使用ggplot对象画图
multiplot(p1,p2)

# 将ggplot对象放入列表中,再用列表画图, 并设置两列的排列方式
plot_lst <- list()
plot_lst[[1]] <- p1
plot_lst[[2]] <- p2
multiplot(plotlist = plot_lst, cols = 2)
参考资料
ClonEvol: clonal ordering and visualization in cancer
sequencing文献里面CloneEvol包里面boxplot.r函数
原文链接:http://www.cnblogs.com/ywliao/p/12419025.html
推荐阅读
热点文章

R语言入门:dnorm(),pnorm(),qnorm(),和rnorm()函数的使用
5
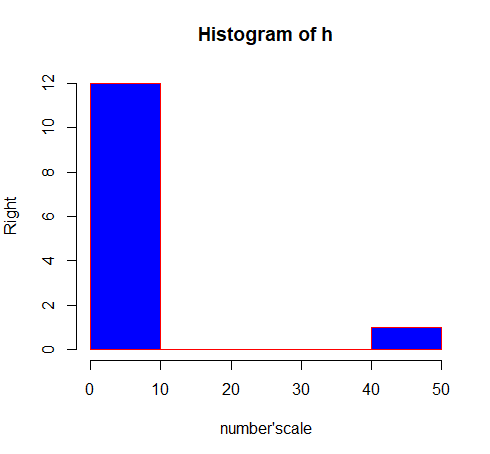
R语言入门:直方图histogram的绘制
11
简单将ggplot多个图排列在一起
54
R语言入门:向量索引
19
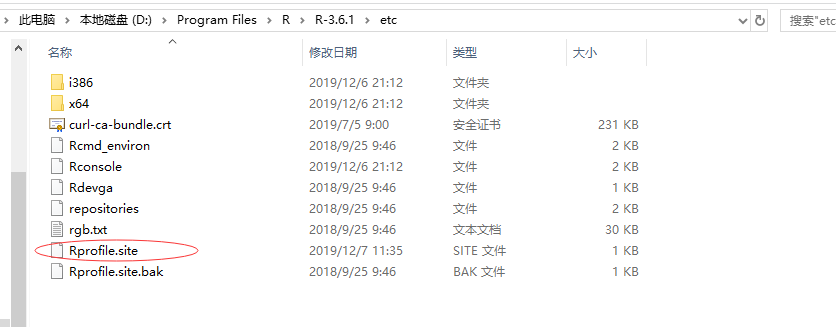
RStudio 不中断下载依赖包
15
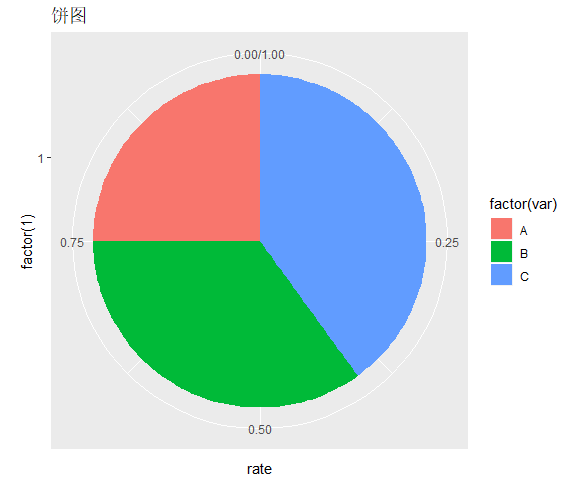
用ggplot包画一个简单饼图
2
面试题7 指定一个m*n的整数矩阵 如果(r, c)位置元素的元素是0 则将行 r 和列 c 整个变成0 - 雄霸天下-无人能挡
6
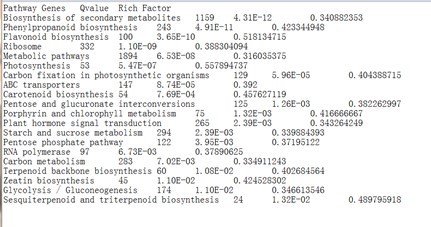
KEGG富集分析散点图.md
12
Web Scraping with R: How to Fill Missing Value (爬虫:如何处理缺失值)
9
R语言dataframe的常用操作总结
15
