react中使用echarts
- 作者: 你的虚伪我赖的敷衍108433236
- 来源: 51数据库
- 2021-07-07
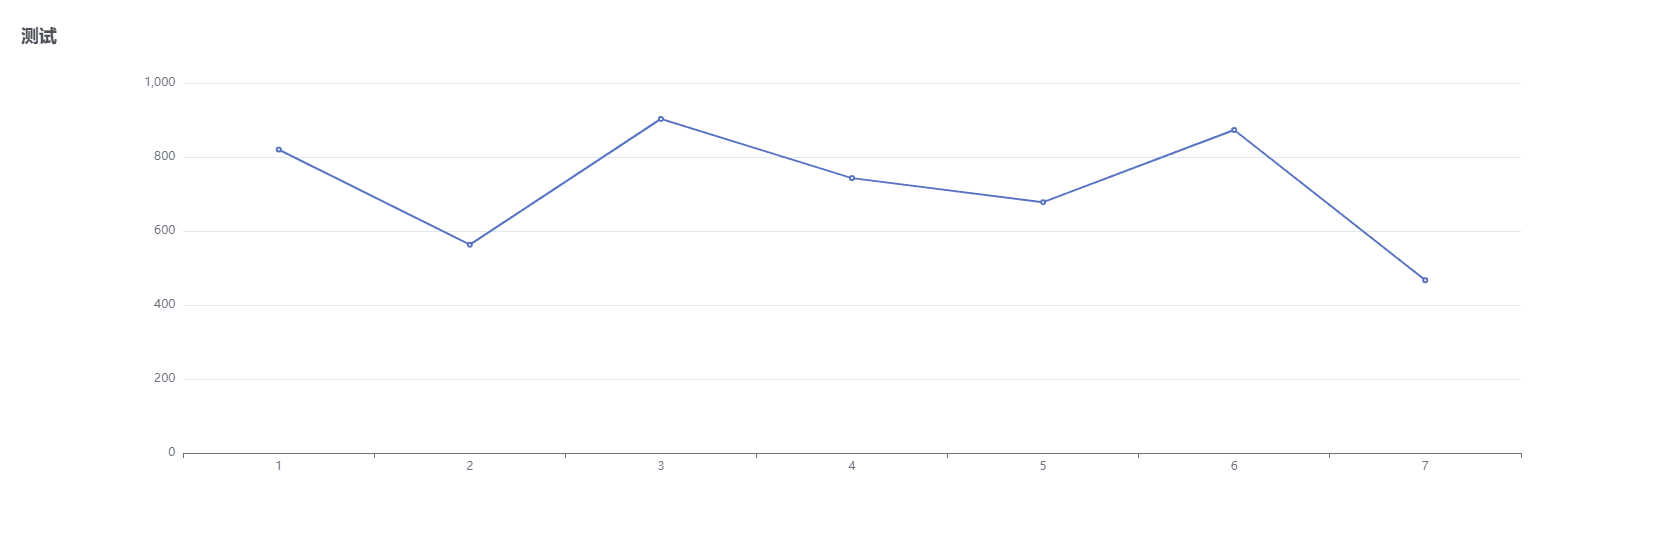
最近再学习react,今天写了react中使用echarts,现在分享给大家,希望对您能有所帮助!不好的话,勿喷!!!
代码如下:
import React, { Component } from 'react'
import * as echarts from 'echarts'

export default class Statics extends Component {
  state = {
    data: [820, 563, 903, 743, 678, 873, 467]
  }

  initCharts = () => {
    let myChart = echarts.init(document.getElementById('myChart'));
    myChart.setOption({
      title: {
        text: '测试'
      },
      tooltip: {
        trigger: 'axis'
      },
      xAxis: {
        type: 'category',
        data: [1, 2, 3, 4, 5, 6, 7]
      },
      yAxis: {
        type: 'value'
      },
      series: [{
        data: this.state.data,
        type: 'line'
      }]
    });
    window.addEventListener("resize", function () {
      myChart.resize();
    })
  }

  componentDidMount() {
    this.initCharts();
  }

  render() {


    return (
      <div>
        <div id='myChart' style={{ width: '100%', height: '500px' }}></div>
      </div>
    )
  }
}
?
推荐阅读